How Can Statistical Analysis Help In Healthcare?
In the vast and complex world of healthcare, data-driven decision-making is becoming increasingly vital. Statistical analysis plays an important role in transforming healthcare by improving patient outcomes. It empowers healthcare professionals and organisations to make informed choices, enhance patient care, and streamline operations. In this article, we'll explore the importance of statistical analysis in healthcare.

Understanding Statistical Analysis
Statistical analysis is a powerful tool that allows healthcare practitioners to make sense of the enormous amount of data generated daily. A process that involves collecting, organising, analysing, and interpreting data to draw meaningful conclusions. These conclusions are critical for improving patient outcomes in several ways.
>> Patient Risk Assessment: Statistical analysis helps in assessing patient risk. By analysing a patient's medical history, lifestyle, and genetic factors, healthcare professionals can predict the likelihood of certain diseases or health complications. This enables early intervention and personalised treatment plans.
>> Treatment Efficacy: Healthcare providers use statistical analysis to determine the effectiveness of different treatment options. They can compare the outcomes of various treatments for a specific condition and identify which one works best for a particular patient.
>> Resource Allocation: Hospitals and healthcare systems use statistical analysis to allocate resources efficiently. By studying patient trends and demands, they can ensure that the right resources, such as staff and equipment, are available when and where they are needed most.
>> Quality Improvement: Continuous quality improvement is a core aspect of healthcare. Statistical analysis identifies areas where healthcare facilities can improve, leading to better patient care. For instance, it can reveal infection rates in a hospital, helping to implement strategies to reduce them.
>> Medical Research: Statistical analysis is essential in medical research. It allows researchers to analyse data from clinical trials, patient surveys, and experiments to draw conclusions about the effectiveness of new treatments and medications.
Also check - Cancer Treatment: Why Chemotherapy Does Not Suit All Patients?
Statistical Tools in Healthcare
Several statistical tools and techniques are commonly used in healthcare to analyse and interpret data. Let's look at a few of them and include some mathematical equations and calculations.
Descriptive Statistics
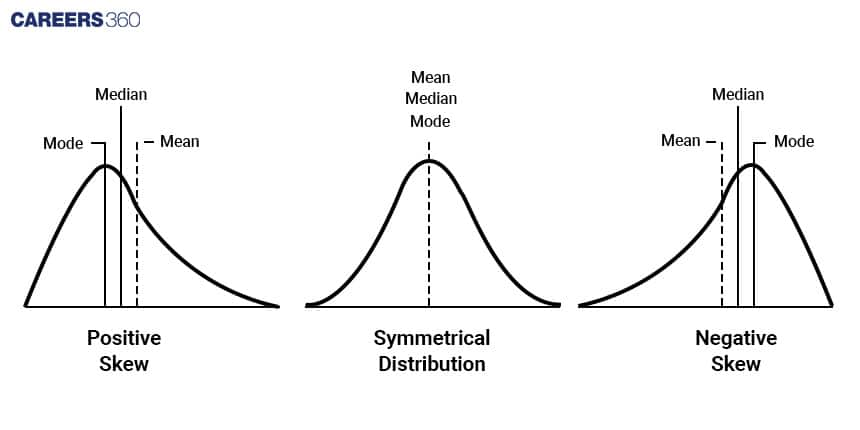
Statistical parameters like mean, mode, median, and many more are used to summarise and describe data. For instance, they help in summarising patient demographics, such as age, gender, and location, to better understand the patient population.
Mean (Average):
The mean is the sum of all data values divided by the total number of data points.
Formula: Mean (μ) = (Σx) / N
Where μ is the mean, Σx is the sum of all data values, and N is the total number of data points.
Median:
The median is the middle value when the data is sorted in ascending order. If there's an even number of data points, the median is the average of the two middle values.
Formula (for an odd number of data points): Median = Middle Value
Formula (for an even number of data points): Median = (Middle Value 1 + Middle Value 2) / 2
Mode (Most Common):
The mode is the value that appears most frequently in the dataset. There can be multiple modes in a dataset.
No specific formula; it's the value with the highest frequency.
Range:
The range is the difference between the maximum and minimum values in the dataset.
Formula: Range = Maximum Value - Minimum Value
Standard Deviation (SD):
Standard deviation measures how spread out the data is from the mean. It quantifies the degree of variation in the dataset.
Formula: SD (σ) = √[(Σ(xi - x̄)²) / N]
Where σ is the standard deviation, xi represents each data point, x̄ is the mean, and N is the total number of data points.
Variance:
Variance is the square of the standard deviation. It measures how much each data point differs from the mean.
Formula: Variance (σ²) = (Standard Deviation)²
Relation between mean, median and mode: Mean - Mode = 3(Mean - Median)
>> Example: Calculating the Mean Age of Patients Mean = (Sum of all ages) / (Total number of patients)
Suppose we have the ages of five patients: 30, 35, 40, 45, and 50.
Mean = (30 + 35 + 40 + 45 + 50) / 5
= 40 years
Descriptive statistics provide a clear snapshot of a patient population, aiding healthcare providers in understanding their patients better.
Inferential Statistics
These are used to make predictions and inferences about a larger population based on a sample. In healthcare, it's common to infer conclusions about a patient population from a smaller group of patients.
>> Example: Hypothesis Testing Hypothesis testing involves comparing sample data to a null hypothesis and determining if the results are statistically significant. Here's a simple example:
Null Hypothesis (H0): The new drug has no effect on blood pressure.
Alternative Hypothesis (Ha): The new drug reduces blood pressure.
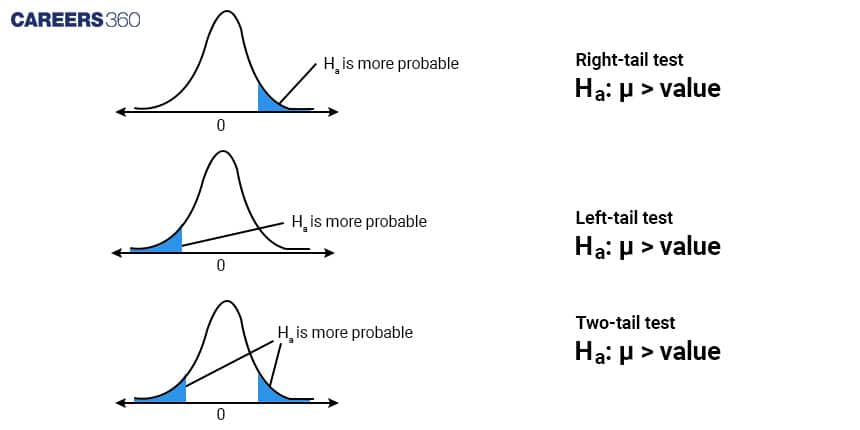
After conducting a study, if the p-value is less than a chosen significance level (e.g., 0.05), we reject the null hypothesis in favour of the alternative hypothesis, indicating that the new drug does reduce blood pressure.
Hypothesis testing is crucial in assessing the impact of new treatments and interventions in healthcare.
Regression Analysis
Regression helps in understanding the relationship between two or more variables. For example, it can determine how a patient's weight and age affect their blood pressure.
Types of Regression Analysis
Linear Regression:
Linear regression is the simplest form of regression analysis. It's used when there's a linear relationship between the independent and dependent variables.
Formula: y = β0 + β1x + ɛ, where y is the dependent variable, x is the independent variable, β0 is the intercept, β1 is the slope, and ɛ is the error term.
>> Example: Linear Regression The relationship between patient weight (in kilograms) and blood pressure (in mmHg) can be modelled using a simple linear regression equation:
Blood Pressure = β0 + β1 * Weight + ε
Here, β0 is the intercept, β1 is the slope, and ε represents the error term. This equation allows us to predict blood pressure based on a patient's weight.
Logistic Regression:
Logistic regression is used when the dependent variable is binary (e.g., 0 or 1, yes or no). It models the probability of an event occurring.
Formula: p = 1 / (1 + e-(β0 + β1x)), where p is the probability, x is the independent variable, β0 is the intercept, β1 is the slope, and e is the base of natural logarithms.
Example: Predicting the likelihood of a patient developing a particular condition (e.g., diabetes).
Polynomial Regression:
In cases where the relationship between variables is not strictly linear, polynomial regression is used. It models data with higher-degree equations.
Formula: y = β0 + β1x + β2x2 + ... + βnxn + ɛ, where n is the degree of the polynomial.
Example: Modelling the progression of a disease over time, which may not follow a linear pattern.
Survival Analysis
This technique is used to analyse the time it takes for a particular event to occur, such as the progression of a disease or the recovery of a patient.
>> Example: Kaplan-Meier Survival Curve In a study on cancer patients, the Kaplan-Meier survival curve is used to estimate the survival probability over time. It's a mathematical representation of how long patients with a particular condition survive.
Here's a simplified example of a survival curve: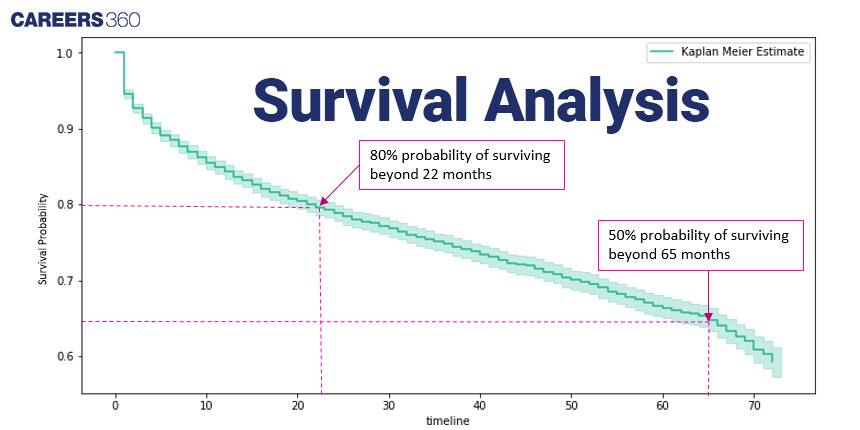
Kaplan-Meier curves are critical in understanding the progression of diseases and evaluating the effectiveness of treatments over time.
These mathematical tools and techniques, when applied to healthcare data, provide valuable insights that improve patient outcomes and the overall quality of healthcare delivery.
Also check - Condensation: What Is Science Behind Droplets Forming On Chilled Surface?
Challenges in Statistical Analysis
While statistical analysis offers numerous benefits to healthcare, it's not without its challenges:
>> Data Quality: Data quality is critical for accurate analysis. Incomplete, inaccurate, or inconsistent data can lead to incorrect conclusions.
Example: Data Cleaning In a patient database, there might be instances of missing or incorrect data, such as incorrect birthdates or duplicate records. Data cleaning involves identifying and rectifying such issues to ensure the data is reliable for analysis.
>> Privacy Concerns: Healthcare data often contains sensitive patient information. Protecting patient privacy is essential, and strict regulations, such as the Health Insurance Portability and Accountability Act (HIPAA), govern data security and sharing.
Example: De-identification Healthcare organisations often de-identify patient data before using it for analysis. This process removes personal identifiers like names and social security numbers, preserving patient privacy.
>> Interpreting Complex Models: Advanced statistical models can be complex. Healthcare professionals may require training to understand and interpret these models effectively.
Example: Logistic Regression Logistic regression is used to predict the probability of a binary outcome, such as whether a patient will develop a particular condition. The model produces a logistic curve that needs interpretation by healthcare professionals to make clinical decisions.
>>Data Volume: The sheer volume of healthcare data generated daily can be overwhelming. Managing and processing such vast amounts of data is a significant challenge.
>> Costs: Implementing and maintaining statistical analysis tools and systems can be costly. Smaller healthcare providers may struggle to invest in these technologies.
Example: Cost-Benefit Analysis Conducting a cost-benefit analysis helps healthcare organisations assess the return on investment for implementing statistical analysis tools.
Articles
Upcoming Exams
Application Date:11 November,2024 - 08 April,2025