

Pedigree Analysis Family Genetics: Definition, Examples, Types, Topic
A pedigree gives us a diagrammatic presentation of family information in the form of an easily readable chart, and can be simply called a “family tree”. The pedigree uses a standardised set of symbols; squares represent males and circles represent females.
This Story also Contains
- Understanding Pedigree Analysis
- What is Pedigree Analysis?
- Pedigree Analysis - Diagram
- Description of the Diagram
- MCQs on Pedigree Analysis
- Recommended Video on Pedigree Analysis

Pedigree construction represents family history and such details about the earlier generations that may be uncertain as memories fade. If the gender of a person is unknown, a diamond shape is used. Heterozygotes, when known, are characterised by a shaded dot inside a symbol or a half-filled symbol. Pedigree analysis is a topic of the chapter Principles of Inheritance and Variation in Biology.
Understanding Pedigree Analysis
Among the major techniques of genetics for studying the inheritance pattern of any characteristic or any type of genetic disorder in the family is pedigree analysis. Pedigree charts are used to trace the transmission of inherited characteristics that are encoded in the genes through successive generations by a set of symbols and formatted diagrams. The diagrams show the family relationships and occurrences of the selected traits, giving, therefore, a generality of the picture of the pattern through which the trait is inherited from one generation to another.
The reason pedigree analysis is important in several ways is that, other than understanding inheritance patterns, it helps in predicting the chances of a person inheriting or passing on a genetic disorder. It facilitates the diagnosis of inherited conditions and helps in genetic counselling. The pedigree analysis identifies the carriers of recessive genes and may be used to understand the risks of certain human genetic disorders in the offspring. It may also provide programs for the management and treatment of genetic conditions.
What is Pedigree Analysis?
It deals with studying family histories and constructing pedigree charts to study the pattern of inheritance. A pedigree chart uses standardised symbols that represent individuals and their relationships so a geneticist can visualise how the occurrence and transmission of traits move across generations. Squares represent males, circles are used for females, and shaded symbols denote that a part of an individual expresses that trait, while unshaded symbols are of the individuals who don't.
The significance of pedigree analysis is to determine the pattern of inheritance of features or traits, or any type of mutation. The distribution in a family concerning a particular trait can be interpreted by a geneticist as autosomal dominant, autosomal recessive, X-linked dominant, X-linked recessive, or mitochondrial. The inference deduced gives information that is very important in estimating the genetic risk of the members of the family and making decisions for the test and genetic counselling of interest.
With autosomal dominant inheritance, only one copy of the altered gene in every cell is needed for an individual to express the disorder. This means there is a 50%, or sometimes greater, chance that each child will have an inherited defect. The autosomal recessive disorder requires a person to have two copies of the altered gene to possess this disorder. This can result in carriers that might have one changed gene but do not express the trait; they can pass it on to their children.
X-linked inheritance involves genes on the X chromosome. Again, most X-linked recessive disorders have an increased incidence in males, since they have one X chromosome, hence one copy of the gene; whereas females have two, with a possible compensating copy of the healthy gene. Some of these disorders are colour blindness, haemophilia, etc. In X-linked dominant disorders, one altered copy of the gene on one of the X chromosomes is enough to produce the disorder in males and females. On the other hand, mitochondrial inheritance is strictly maternal, since mitochondrial DNA is passed on exclusively by the mother.
Pedigree Analysis - Diagram
Analysis of pedigree charts like these allows a geneticist to infer the pattern of inheritance of the trait, identify carriers, and calculate the risks for the transmission of the characteristic into subsequent generations. Diagrammatic presentation plays a vital role in genetics research and the management of genetic diseases.
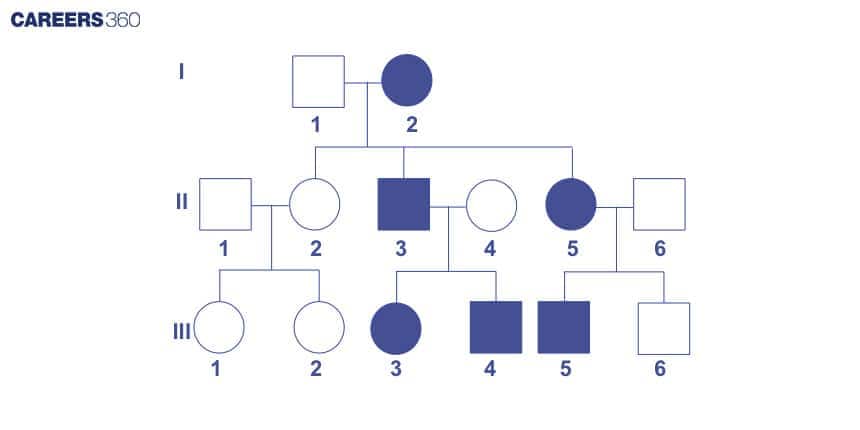
Description of the Diagram
The diagram given above is explained below. The symbols, lines, generation, individual, and the patterns are thoroughly explained.
Symbols
Squares represent males.
Circles represent females.
Shaded symbols indicate individuals who express the trait.
Unshaded symbols represent individuals who do not express the trait.
Half-shaded symbols may indicate carriers of a recessive trait.
Lines
Horizontal lines connecting a male and a female represent mating.
Vertical lines descending from a couple represent their offspring.
Sibling lines are horizontal lines connecting offspring from the same parents.
Generations
Each row represents a different generation.
Generations are labelled with Roman numerals (I, II, III, etc.).
Individuals
Individuals within each generation are numbered sequentially from left to right.
Affected individuals are shaded to show the presence of the trait.
Patterns
The diagram helps identify the inheritance pattern by showing the trait distribution across multiple generations.
Autosomal dominant traits typically appear in every generation, while autosomal recessive traits may skip generations.
X-linked traits show different patterns in males and females, often affecting more males in X-linked recessive conditions.
MCQs on Pedigree Analysis
Q1. Which one of the following is the correct option?
Option 1: In pedigree analysis, a family tree can be represented by a pedigree chart with all the members of a family.
Option 2: In the pedigree analysis, standard symbols are used to distinguish between different families.
Option 3: Both (a) and (b) are incorrect.
Option 4: Both (a) and (b) are correct.
Correct answer: 4) Both (a) and (b) are correct.
Explanation:
Both claims are true: In pedigree analysis, standard symbols are used to differentiate between various families, and a pedigree chart can depict a family tree with all of its members.
Chart of Pedigrees A pedigree chart is a visual representation of a family tree in which people and their ties are represented by symbols. It can help determine inheritance patterns and indicate whether a genetic characteristic is present in a family.
Standard symbols In a pedigree chart, standard symbols are used to indicate various people and their relationships. For instance, a solid sign denotes a person with a characteristic, a square denotes a man, and a circle denotes a woman.
Hence, the correct answer is option 4) Both (a) and (b) are correct.
Q2. Which one of the following symbols represents mating between relatives in human pedigree analysis?
Option 1: 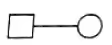
Option 2: 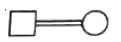
Option 3: 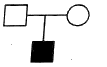
Option 4: 
Correct answer: 2)
Explanation:
In human pedigree analysis, mating between relatives is represented by a double horizontal line connecting a male and a female. This symbol indicates consanguineous mating, which means that the individuals involved share a common ancestor. The double horizontal line represents a marriage or mating relationship, while the vertical lines extending downward from the double line represent their offspring.
Hence, the correct answer is option 2)  .
.
Q3. Consanguineous marriages show
Option 1: Increase in the appearance of recessive defective traits
Option 2: Marriages in blood relations
Option 3: Union of gametes within the same genetic ancestry
Option 4: All of the above
Correct answer: 4) All of the above.
Explanation:
Consanguineous marriages refer to marriages between individuals who are closely related by blood, such as cousins or more distant relatives. These marriages can have several effects, including:
(1) Increase in the appearance of recessive defective traits: Consanguineous marriages increase the likelihood of offspring inheriting two copies of a recessive defective gene. When close relatives marry, they are more likely to carry similar recessive genes, which increases the chances of these genes being inherited by their offspring. If both parents carry the same recessive defective gene, their children have a higher probability of inheriting two copies of the gene, leading to the expression of a recessive genetic disorder.
(2) Marriages in blood relations: Consanguineous marriages explicitly involve the union of individuals who are closely related by blood. This can include marriages between cousins, siblings, or other blood relatives.
(3) Union of gametes within the same genetic ancestry: Consanguineous marriages involve the union of gametes (sperm and egg) from individuals who share a close genetic ancestry. This means that the genetic material being combined during reproduction is derived from a relatively limited gene pool, which can increase the chances of inheriting both desirable and undesirable genetic traits.
It is important to note that while consanguineous marriages do increase the risk of inheriting certain genetic disorders, not all offspring from such marriages will necessarily have negative health outcomes. The expression of genetic disorders depends on various factors, including the specific genetic makeup of the individuals involved and the presence of other modifying genetic or environmental factors.
Hence, the correct answer is option 4) All of the above.
Also Read:
Recommended Video on Pedigree Analysis
Frequently Asked Questions (FAQs)
Pedigree analysis is a process through which a scientist can study what type of inheritance pattern any particular trait or hereditary disorder shows in a family. These include pedigree charts, which represent the generally applied visual account of family relationships and the occurrence of particular traits over generations.
When reading a pedigree chart, note the male symbol, which is a square, and the female symbol, which is a circle. Shading indicates if an individual expresses (is affected by) the trait, whereas an unshaded symbol signifies its absence. Lines relate individuals to one another, and one may describe the relationships in the family tree and trace the inheritance of the traits.
Common symbols include squares for males, circles for females, shaded symbols for individuals expressing the trait, shaded circles or squares if only one parent has the trait but their offspring can express it, and unshaded circles or squares for individuals who don't. Horizontal lines connect the mates, and vertical lines connect parents to their offspring.
Inheritance patterns include autosomal dominance, autosomal recessive, X-linked dominance, X-linked recessiveness, and mitochondrial inheritance. All of them have typical features that influence the passage of characteristics from one generation to another.
Pedigree analysis helps in the identification of carriers of genetic disorders, prediction of chances of inheritance or passing on a disorder, and diagnosis of inherited conditions.
