Graphical Comparison of Thermodynamic Processes

Graphical Comparison of Thermodynamic Processes

Edited By Shivani Poonia | Updated on Jul 02, 2025 06:32 PM IST

Thermodynamics is the area of physics dealing with heat and other types of energy. In particular, thermodynamics explains how thermal energy is transformed into and from other kinds of energy, and its interrelation with matter. Any thermodynamic process is a process of energy transfer within a system or between systems. The properties of a thermodynamic process are pressure, temperature, and volume. The state of the system at the present time is called the thermodynamic state of a system. An excellent example of a thermodynamic process is when food stays cool inside a refrigerator. A refrigerator removes the heat from the inside compartments and transfers it to the air on the outside.

This Story also Contains
  1. Constant Volume Process
  2. Work done during the process:
  3. Constant Pressure Process:
  4. Some Solved Examples
  5. Summary
Graphical Comparison of Thermodynamic Processes

Constant Volume Process

Representation on P-V diagram:

This process is represented on the P-V diagram by a vertical straight line as shown in the figure, since V1=V2.

Work done during the process:

W=∫V1V2Pdv

But dv=0 for an isochoric process

∴W=0

Thus, work done during the constant volume process is zero which is also evident from the P-V diagram as no area is enclosed by the vertical line on the P-V diagram.

Constant Pressure Process:

Representation on P-V diagram:

During this process the pressure or the gas remains constant therefore it is represented by a horizontal line on the P-V diagram. See figure.

Work done during the process:


W=∫V1But P is constant.
∴ Work done =P∫V1V2dv=P(V2−V1)

A rectangle on P-V diagram represents the work done by the gas during the constant pressure process.

Recommended topic video on (Graphical Comparison of Thermodynamic Processes)


Some Solved Examples

Example 1: One mole of an ideal gas expands from state X to Y by three paths 1, 2, and 3 as shown in the figure below. If W1, W2, and W3 are respective work done by ideal gas along the three paths then:

1)W1=W2=W3

2)W3>W1>W2

3) W3>W2>W1

4)W1>W2>W3

Solution

Work is a path function and not a state function. The area under P-V curve gives Work done. As far as the magnitude is concerned, work done by gas will be maximum in path 3 because the area under the curve is highest in the case of path 3. The second highest area is under path 2 and the least area is of curve 1.
Hence, Option number (3) is correct

Example 2: The magnitude of work done by a gas that undergoes a reversible expansion along the path ABC shown in the figure is

1) 489Correct)

2)85

3)58

4)54

Solution

W=(8−2)2+12((12−8)×(8−2))W=48

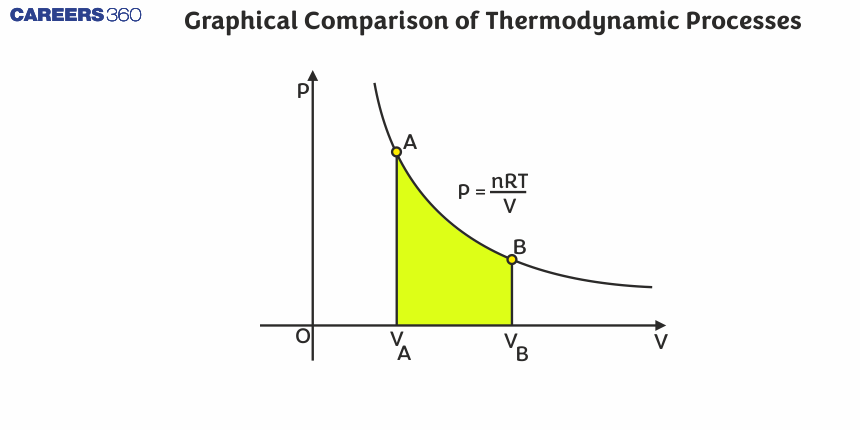
Example 3: What is the relation between the temperatures in the below graph which represents an isothermal expansion of gas at different temperatures?

1)T1>T2>T3

2)T2>T3>T1

3) T3>T2>T1

4)No relationship can be established

Solution

In the isothermal process, Temperature is constant.
Also, we know for an ideal gas, PV=nRT

As we can see T is constant, so we can say PV=k (here k is constant).

This equation of PV=k represents the equation of a hyperbola.

The higher the value of k the farther the curve is from the origin. So we can conclude that
T3>T2>T1
Hence, Option number (3) is correct

Example 4: Find out the magnitude of work (in kJ) done by one mole of an ideal gas for expansion.

1)-1

2)2

3) 6

4)60

Solution

Work is a path function and not a state function and the area under the P-V curve gives work.

So, work will be the total area of the Trapezium

∴∣ work |=12×( sum of parallel sides )×( distance between the parallel sides )∴∣ work |=12×6×20=60×10−5 bar − lit ∴∣ work ∣=60×105 bar − lit =60×105×10−3 bar −m3=6000 J

Thus, the magnitude of work done is 6 kJ

Example 5: One mole of an ideal monoatomic gas is subjected to changes as shown in the graph. The magnitude of the work done (by the system or on the system) is_________ J (nearest integer )

1) 6

2)7

3)4

4)6.5

Solution

I→II→ Isobaric II→III→ Isochoric III→I→ Isothermal WI−II=−1[40−20]=−20 Lit atm WII−III=0 WIV-I =2.303nRtlog⁡V2 V1

=2.303PVlog⁡V2 V1=2.303(1×20)log⁡2=2.303×20×0.3010=13.818

W total =−20+13.818=(−6.182 lit atm )=6.182 lit atm

Summary

It's an interesting area of physics that deals mainly with the interaction of different kinds of energy, especially heat. How it describes the transformation of thermal energy into other forms of energy and how it influences the matter is quite interesting.
A thermodynamic process can be said to be a transfer of energy either within or between systems. The properties of the system in consideration are considered significant in these processes. The values of such properties at any given time describe the thermodynamic state of the system. An elementary example of a thermodynamic process could be the heating of water in a kettle. The heat from the surroundings—the stove—is transferred and absorbed by the kettle's system, which raises the temperature of the water.


Frequently Asked Questions (FAQs)

1. Why are graphs important in understanding thermodynamic processes?
Graphs are important in understanding thermodynamic processes because they provide a visual representation of complex relationships between variables. They allow us to easily compare different processes, identify key characteristics, and predict system behavior. Graphs also help in calculating work done, heat transferred, and changes in internal energy, making them invaluable tools for analyzing thermodynamic systems.
2. What is a graphical comparison of thermodynamic processes?
A graphical comparison of thermodynamic processes is a visual representation of how thermodynamic variables (such as pressure, volume, and temperature) change during different processes. These graphs typically use pressure-volume (P-V), temperature-volume (T-V), or pressure-temperature (P-T) diagrams to illustrate how a system evolves from one state to another.
3. What is the significance of isotherms on a P-V diagram?
Isotherms on a P-V diagram are curves that represent processes occurring at constant temperature. They are typically hyperbolic in shape for ideal gases. Isotherms are significant because they allow us to visualize how pressure and volume change while temperature remains constant, helping us understand the behavior of gases and other substances under different conditions.
4. How does the slope of a P-V curve relate to the compressibility of a substance?
The slope of a P-V curve is related to the compressibility of a substance. A steeper slope indicates lower compressibility, meaning the substance resists volume changes when pressure is applied. A shallower slope indicates higher compressibility, meaning the substance's volume changes more easily with pressure changes. This relationship helps in understanding the behavior of different materials under varying pressure conditions.
5. How can you distinguish between reversible and irreversible processes on a P-V diagram?
On a P-V diagram, reversible processes are represented by smooth, continuous curves where the system is always in equilibrium with its surroundings. Irreversible processes are typically shown as dashed lines or abrupt changes, indicating that the system is not in equilibrium during the process. Reversible processes can be traced in both directions, while irreversible processes can only proceed in one direction.
6. What is the difference between an isobaric and an isochoric process on a P-V diagram?
On a P-V diagram, an isobaric process appears as a horizontal line, indicating constant pressure as volume changes. An isochoric process appears as a vertical line, showing constant volume as pressure changes. Isobaric processes involve work being done by or on the system, while isochoric processes involve no work as the volume remains constant.
7. What can the slope of a process curve on a P-V diagram tell us about the process?
The slope of a process curve on a P-V diagram provides information about the nature of the process. A vertical line (infinite slope) indicates an isochoric process. A horizontal line (zero slope) represents an isobaric process. Curves with negative slopes show the typical inverse relationship between pressure and volume. The steepness of the slope can indicate how quickly pressure changes with volume, giving insights into the process's characteristics.
8. How do real gas P-V curves differ from ideal gas curves?
Real gas P-V curves deviate from ideal gas curves, especially at high pressures and low temperatures. Real gas curves show more compression at high pressures due to intermolecular forces. At very low temperatures, they may show a sudden volume decrease during condensation. These deviations are due to factors like molecular size and intermolecular attractions, which are neglected in the ideal gas model.
9. How does a P-V diagram change for substances with different equations of state?
P-V diagrams for substances with different equations of state will show distinct curve shapes and behaviors. For example, the van der Waals equation of state produces curves that better represent real gas behavior, showing deviations from ideal gas law at high pressures and low temperatures. Other equations of state may produce curves that capture specific behaviors of certain substances or conditions, such as near critical points or for complex mixtures.
10. What is the significance of the compressibility factor in P-V diagrams?
The compressibility factor (Z) in P-V diagrams indicates how much a real gas deviates from ideal gas behavior. On a P-V diagram, lines of constant Z can be plotted. When Z=1, the gas behaves ideally. Deviations from Z=1 show non-ideal behavior, with Z<1 indicating greater compressibility than an ideal gas, and Z>1 indicating less compressibility. This factor is crucial for accurate predictions of gas behavior in various applications.
11. What does the area under a P-V curve represent in a thermodynamic process?
The area under a pressure-volume (P-V) curve represents the work done by or on the system during a thermodynamic process. If the area is positive (system expands), it represents work done by the system on the surroundings. If the area is negative (system compresses), it represents work done on the system by the surroundings.
12. How can you use a P-V diagram to calculate the work done in a thermodynamic process?
To calculate the work done in a thermodynamic process using a P-V diagram, you need to find the area under the curve representing the process. For simple shapes, you can use geometric formulas. For more complex curves, you may need to use integration or numerical methods. Positive area (expansion) represents work done by the system, while negative area (compression) represents work done on the system.
13. What information can be derived from the intersection of two different process curves on a P-V diagram?
The intersection of two different process curves on a P-V diagram represents a state where the system has the same pressure and volume under different conditions. This point allows comparison of other thermodynamic properties (like temperature or entropy) for the two processes at that specific state. It's useful for analyzing how different paths can lead to the same thermodynamic state.
14. What does a cyclic process look like on a P-V diagram?
A cyclic process on a P-V diagram appears as a closed loop. The system starts and ends at the same point, indicating that it returns to its initial state after undergoing a series of processes. The area enclosed by the loop represents the net work done by or on the system over the entire cycle. Cyclic processes are fundamental in understanding heat engines and refrigeration cycles.
15. What does the spacing between isotherms on a P-V diagram indicate about a substance's behavior?
The spacing between isotherms on a P-V diagram provides information about a substance's thermal expansion characteristics. Wider spacing indicates a greater change in volume for a given temperature change, suggesting higher thermal expansion. Closer spacing indicates less volume change with temperature, implying lower thermal expansion. This spacing can vary for different substances and can change in different regions of the diagram.
16. How can you determine if a process is adiabatic from its representation on a P-V diagram?
An adiabatic process on a P-V diagram is represented by a curve steeper than an isothermal curve. It shows a more rapid pressure change with volume compared to an isothermal process. Adiabatic curves do not intersect each other or isothermal curves for the same substance. The lack of heat transfer in adiabatic processes results in this distinct curve shape.
17. What is the significance of the critical point on a P-V diagram?
The critical point on a P-V diagram represents the conditions (critical temperature and pressure) at which the distinction between liquid and gas phases disappears. At this point, the substance exists in a single, homogeneous phase with properties of both liquid and gas. The critical point is significant in understanding phase transitions and the behavior of substances at extreme conditions.
18. How does a polytropic process appear on a P-V diagram?
A polytropic process on a P-V diagram appears as a curve that lies between the isothermal (less steep) and adiabatic (steeper) curves for the same substance. The exact shape depends on the polytropic index, which determines the relationship between pressure and volume changes. Polytropic processes are useful for modeling real-world processes that involve some heat transfer but are not purely isothermal or adiabatic.
19. How can you use a P-V diagram to visualize the Joule-Thomson effect?
The Joule-Thomson effect can be visualized on a P-V diagram by observing the slope of constant enthalpy lines (isenthalps). If these lines have a positive slope, the substance will cool upon expansion (positive Joule-Thomson coefficient). If they have a negative slope, the substance will heat upon expansion (negative Joule-Thomson coefficient). The point where the slope changes sign is called the inversion point.
20. What is the significance of the triple point on a P-V diagram?
The triple point on a P-V diagram represents the unique combination of pressure and temperature at which solid, liquid, and gas phases of a substance coexist in equilibrium. It appears as a single point on the diagram where the solid-liquid, liquid-gas, and solid-gas phase boundaries intersect. The triple point is important in defining thermodynamic scales and understanding phase behavior.
21. How does the Maxwell construction appear on a P-V diagram, and what does it represent?
The Maxwell construction appears on a P-V diagram as a horizontal line drawn across an S-shaped isotherm in the two-phase region. It represents the vapor pressure at a given temperature. The areas above and below this line are equal, ensuring that the Gibbs free energy is the same for both phases at equilibrium. This construction is crucial for determining the correct vapor pressure and understanding phase equilibria.
22. How can you use a P-V diagram to explain the concept of a throttling process?
A throttling process can be explained on a P-V diagram as a horizontal line in the P-h (pressure-enthalpy) space, which translates to a curve on the P-V diagram. This process involves a pressure drop at constant enthalpy. On the P-V diagram, it appears as a curve where pressure decreases while volume increases. The shape of this curve can indicate whether the gas cools or heats during expansion (Joule-Thomson effect).
23. What does the shape of an isotherm near the critical point tell us on a P-V diagram?
Near the critical point on a P-V diagram, the shape of an isotherm becomes increasingly flat and develops an inflection point. This flattening indicates that large volume changes can occur with small pressure changes, reflecting the high compressibility of the substance near its critical point. The disappearance of the liquid-vapor distinction is also evident as the flat portion of the isotherm (representing phase transition) shrinks to a point.
24. How do phase transitions appear on a P-V diagram?
Phase transitions on a P-V diagram appear as horizontal lines (for pure substances) where pressure remains constant as volume changes. These lines represent the coexistence of two phases. For example, the liquid-vapor transition appears as a flat line where both liquid and vapor exist together. The end points of these lines represent the saturated liquid and saturated vapor states.
25. How can you use a P-V diagram to explain the concept of mechanical equilibrium?
Mechanical equilibrium can be explained using a P-V diagram by considering a point on the diagram. At any given point, the pressure of the system is equal to the external pressure, representing mechanical equilibrium. If the system's pressure differs from the external pressure, the system will move along a path on the diagram until equilibrium is reached. This concept is fundamental in understanding how systems respond to pressure changes.
26. What does a quasi-static process look like on a P-V diagram?
A quasi-static process on a P-V diagram appears as a smooth, continuous curve. This represents a series of infinitesimal changes where the system is always infinitesimally close to equilibrium. Quasi-static processes are idealized and reversible, allowing the system to be described by equilibrium states at each point. They are important in theoretical thermodynamics for understanding maximum efficiency and ideal behavior.
27. How can you use a P-V diagram to illustrate the concept of path dependence in thermodynamics?
Path dependence can be illustrated on a P-V diagram by showing different paths between two states. While state functions (like internal energy) depend only on the initial and final states, path functions (like work and heat) depend on the specific path taken. By drawing different curves between two points on the diagram, you can show how the area under each curve (representing work) differs, demonstrating that work is path-dependent.
28. What information can be derived from the curvature of a process line on a P-V diagram?
The curvature of a process line on a P-V diagram provides information about how the relationship between pressure and volume changes during the process. A straight line indicates a linear relationship, while curved lines show non-linear relationships. The direction and degree of curvature can indicate whether the process is becoming more or less compressible, or if it's approaching a phase transition or critical point.
29. What can the tangent to a curve on a P-V diagram tell us about the process?
The tangent to a curve on a P-V diagram provides information about the instantaneous rate of change of pressure with respect to volume at that point. The slope of the tangent indicates how quickly pressure is changing with volume. A horizontal tangent suggests a turning point or extremum in the process, while the sign of the slope indicates whether pressure is increasing or decreasing with volume change.
30. How can you use a P-V diagram to explain the concept of thermodynamic stability?
Thermodynamic stability can be explained using a P-V diagram by examining the shape of isotherms. In stable regions, isotherms have a negative slope (∂P/∂V < 0), indicating that an increase in pressure leads to a decrease in volume, which is mechanically stable. Regions with positive slopes are unstable and can lead to phase transitions. The inflection points of isotherms, where the curvature changes, indicate the limits of stability.
31. What does the area between two different process curves on a P-V diagram represent?
The area between two different process curves on a P-V diagram represents the difference in work done between the two processes. If the processes start and end at the same points, this area shows the net difference in work. This concept is crucial in comparing the efficiency of different thermodynamic cycles or in understanding the advantages of one process over another in terms of energy transfer.
32. How can you use a P-V diagram to illustrate the concept of a heat engine?
A heat engine can be illustrated on a P-V diagram as a closed loop representing a cyclic process. The clockwise direction of the cycle indicates that net work is done by the system. The area enclosed by the loop represents the net work output per cycle. Different parts of the loop can represent different processes (e.g., isothermal expansion, adiabatic compression), allowing visualization of how the engine converts heat into work.
33. What is the significance of the ideal gas law curve on a P-V diagram?
The ideal gas law curve on a P-V diagram is a hyperbola (PV = constant) that represents the behavior of an ideal gas at constant temperature. It serves as a reference for comparing real gas behavior. Deviations from this curve indicate non-ideal behavior due to factors like intermolecular forces and molecular size. The ideal gas curve is crucial for understanding gas behavior under various conditions and for developing more complex models.
34. How can you use a P-V diagram to illustrate the concept of internal energy changes?
While internal energy changes are not directly shown on a P-V diagram, they can be illustrated by considering the area under the curve (work) and the heat added or removed. For a closed system, the change in internal energy is the sum of heat added and work done on the system. By showing different paths between two states and considering the areas under these paths, you can demonstrate how different combinations of heat and work can lead to the same internal energy change.
35. What information can be derived from the spacing between isobars on a T-V diagram?
The spacing between isobars on a T-V diagram provides information about the thermal expansion coefficient of the substance. Wider spacing indicates a larger volume change for a given temperature change at constant pressure, implying a higher thermal expansion coefficient. Conversely, closer spacing suggests a lower thermal expansion coefficient. This spacing can vary for different substances and can change in different regions of the diagram, reflecting changes in material properties.
36. How does the behavior of a van der Waals gas differ from an ideal gas on a P-V diagram?
On a P-V diagram, a van der Waals gas shows significant deviations from ideal gas behavior, especially at high pressures and low temperatures. The curves are less hyperbolic and show a more complex shape. At low temperatures, they exhibit a region where pressure increases with volume (unstable region), which is not seen in ideal gases. This difference arises from accounting for molecular size and intermolecular attractions in the van der Waals equation.
37. What can the slope of an isotherm at different points on a P-V diagram tell us about a substance's compressibility?
The slope of an isotherm at different points on a P-V diagram indicates the isothermal compressibility of the substance. A steeper negative slope suggests lower compressibility, meaning the substance resists volume changes when pressure is applied. A shallower slope indicates higher compressibility. The variation in slope across the diagram can reveal how a substance's compressibility changes under different pressure an

Articles

Back to top