1. What exactly is an Acceleration-Time Graph?
The acceleration-time graph plots the acceleration versus time for a particle travelling in a straight line.
2. What can we learn from an Acceleration-Time graph?
In the same way as velocity versus time graphs inform us about an object's displacement, acceleration-time graphs tell us about its velocity.
3. What does the area beneath the acceleration graph represent?
The change in velocity for a given time interval is shown by the area under any acceleration graph for that time interval.
4. What message does the slope of the acceleration time graph convey?
The jerk is represented by the slope of the acceleration time graph.
5. How can you make an acceleration-time graph?
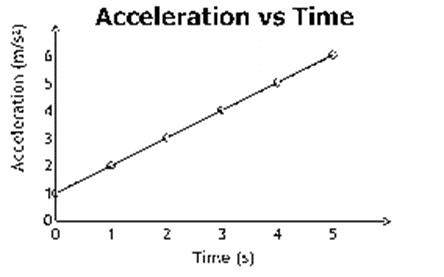
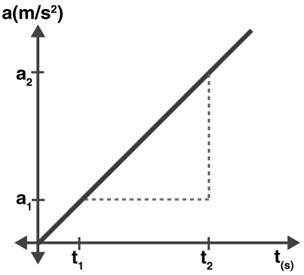
Acceleration measurements are plotted on the y-axis, while time values are plotted on the x-axis in the acceleration versus time graph.
6. What is an acceleration-time graph?
An acceleration-time graph is a visual representation that shows how an object's acceleration changes over time. The vertical axis represents acceleration, typically measured in meters per second squared (m/s²), while the horizontal axis represents time, usually in seconds. This graph helps us understand how the rate of change of velocity varies during an object's motion.
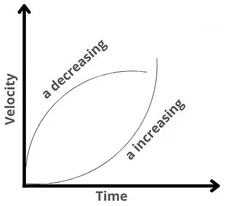
7. How does the shape of an acceleration-time graph differ from a velocity-time graph?
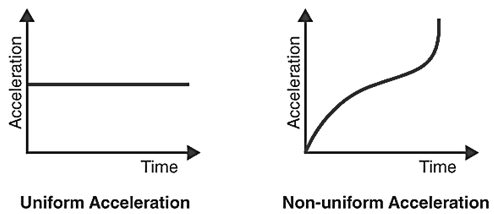
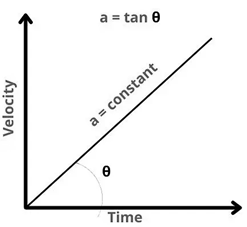
The shape of an acceleration-time graph can be quite different from a velocity-time graph. While a velocity-time graph shows the change in velocity over time, an acceleration-time graph shows the rate of change of velocity. A constant acceleration appears as a horizontal line on an acceleration-time graph, whereas it would be a sloped line on a velocity-time graph.
8. What does a horizontal line on an acceleration-time graph represent?
A horizontal line on an acceleration-time graph represents constant acceleration. This means the object's velocity is changing at a steady rate over time. For example, an object in free fall (ignoring air resistance) would have a horizontal line on its acceleration-time graph, as the acceleration due to gravity remains constant.
9. Can acceleration be negative on an acceleration-time graph?
Yes, acceleration can be negative on an acceleration-time graph. Negative acceleration means the object is slowing down if it was initially moving in the positive direction, or speeding up if it was initially moving in the negative direction. On the graph, negative acceleration would be represented by points below the time axis.
10. What does the area under an acceleration-time graph represent?
The area under an acceleration-time graph represents the change in velocity over the given time interval. This is because acceleration is the rate of change of velocity with respect to time. By calculating the area, we're essentially integrating acceleration over time, which gives us the velocity change.
11. Can you determine the direction of motion from an acceleration-time graph alone?
No, you cannot determine the direction of motion from an acceleration-time graph alone. The acceleration-time graph shows how the rate of change of velocity varies, but without knowing the initial conditions (like initial velocity or position), you can't determine the actual direction of motion. Positive acceleration doesn't always mean forward motion, and negative acceleration doesn't always mean backward motion.
12. How would the acceleration-time graph look for a car braking to a stop, then immediately accelerating again?
The acceleration-time graph for a car braking to a stop, then immediately accelerating again would look like:
13. How can you use an acceleration-time graph to determine when an object is moving fastest?
To determine when an object is moving fastest using an acceleration-time graph:
14. How would you represent the motion of a pendulum on an acceleration-time graph?
The motion of a pendulum on an acceleration-time graph would show:
15. What does a step function on an acceleration-time graph represent?
A step function on an acceleration-time graph represents an abrupt change in acceleration. This could represent:
16. What does the area between two points on an acceleration-time graph represent if the acceleration is not constant?
17. What's the difference between average acceleration and instantaneous acceleration on an acceleration-time graph?
On an acceleration-time graph:
18. How would you represent a car's "stop-and-go" traffic motion on an acceleration-time graph?
A car's "stop-and-go" traffic motion on an acceleration-time graph would look like a series of alternating positive and negative regions:
19. What does a symmetrical acceleration-time graph indicate about an object's motion?
A symmetrical acceleration-time graph often indicates a motion that has a "forward" and "backward" phase that mirror each other. For example, an object thrown straight up and falling back down (ignoring air resistance) would have a symmetrical graph. It suggests that the object experiences the same accelerations in reverse order during the second half of its motion.
20. How does the acceleration-time graph of a car changing gears look like?
The acceleration-time graph of a car changing gears might show:
21. How would the acceleration-time graph look for an object in free fall, then hitting a cushion?
The acceleration-time graph for an object in free fall, then hitting a cushion would look like:
22. How can you determine if an object is speeding up or slowing down from an acceleration-time graph?
To determine if an object is speeding up or slowing down, you need to consider both the acceleration-time graph and the initial velocity:
23. Can an acceleration-time graph have discontinuities?
Yes, an acceleration-time graph can have discontinuities, but these represent idealized situations that are not physically realizable. A discontinuity would imply an instantaneous change in acceleration, which would require infinite force. In real-world scenarios, changes in acceleration occur over a finite (though sometimes very small) time interval.
24. Can you have infinite acceleration on an acceleration-time graph?
In theory, you can represent infinite acceleration on an acceleration-time graph as a vertical line. However, this is a mathematical idealization and not physically possible. In reality, no object can experience truly infinite acceleration as it would require infinite force. Any apparent "instantaneous" changes in velocity actually occur over a very small, but non-zero, time interval.
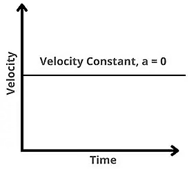
25. What does a zero acceleration on an acceleration-time graph mean?
Zero acceleration on an acceleration-time graph, represented by a point on the time axis, means the object's velocity is not changing at that instant. This could indicate that the object is either at rest or moving with constant velocity. Remember, zero acceleration doesn't necessarily mean the object is not moving; it just means its speed and direction are not changing.
26. How can you use an acceleration-time graph to find displacement?
To find displacement using an acceleration-time graph, you need to perform two integrations:
27. How would the acceleration-time graph look for an object moving in a circle at constant speed?
For an object moving in a circle at constant speed, the acceleration-time graph would show a constant, non-zero value. This is because the object experiences a constant centripetal acceleration directed towards the center of the circle. The magnitude of this acceleration is v²/r, where v is the speed and r is the radius of the circle.
28. Can an object have zero velocity but non-zero acceleration on an acceleration-time graph?
Yes, an object can have zero velocity but non-zero acceleration. This occurs at the moment when an object changes direction. For example, when you throw a ball straight up, at its highest point:
29. How does air resistance affect the acceleration-time graph of a falling object?
Air resistance causes the acceleration of a falling object to decrease over time. The acceleration-time graph would start at -9.8 m/s² (acceleration due to gravity) and then curve upward, approaching zero as the object nears its terminal velocity. At terminal velocity, the acceleration becomes zero, and the graph line meets the time axis.
30. How does the acceleration-time graph look for an object thrown vertically upward and then falling back down?
For an object thrown vertically upward and falling back down (ignoring air resistance), the acceleration-time graph would be a horizontal line below the time axis. The acceleration is constant and equal to -9.8 m/s² (acceleration due to gravity) throughout the motion, both while going up and coming down. The negative sign indicates that the acceleration is downward, opposing the initial upward motion.
31. How does the acceleration-time graph of a car starting from rest and then coming to a stop look like?
The acceleration-time graph of a car starting from rest and then coming to a stop might look like this:
32. What does a curved line on an acceleration-time graph represent?
A curved line on an acceleration-time graph represents a continuously changing acceleration. This means the rate of change of velocity is not constant but is itself changing over time. For example, an object experiencing increasing air resistance might show a curved line on its acceleration-time graph as its acceleration decreases non-linearly.
33. How does the acceleration-time graph of a bouncing ball look like?
The acceleration-time graph of a bouncing ball would show a series of spikes:
34. What information can you derive from the slope of an acceleration-time graph?
The slope of an acceleration-time graph represents the rate of change of acceleration, which is called jerk. Jerk is the third derivative of position with respect to time. A positive slope indicates increasing acceleration (positive jerk), while a negative slope indicates decreasing acceleration (negative jerk). The steeper the slope, the greater the magnitude of the jerk.
35. What does a repeating pattern on an acceleration-time graph indicate?
A repeating pattern on an acceleration-time graph indicates periodic motion. This means the object's acceleration (and consequently its velocity and position) goes through a cycle that repeats at regular intervals. Examples include simple harmonic motion (like a mass on a spring), circular motion, or any cyclical process like a piston in an engine.
36. How do you calculate the area under an acceleration-time graph?
To calculate the area under an acceleration-time graph, you need to consider the shape formed by the graph. For simple shapes:
37. What does a sloped line on an acceleration-time graph indicate?
A sloped line on an acceleration-time graph indicates changing acceleration, also known as jerk. If the line slopes upward, the acceleration is increasing over time. If the line slopes downward, the acceleration is decreasing. This means the rate at which the object's velocity changes is itself changing.
38. How does the acceleration-time graph of a simple harmonic motion look like?
The acceleration-time graph of simple harmonic motion (like a mass on a spring) is a sinusoidal wave. It oscillates between positive and negative values, crossing the time axis periodically. The magnitude of acceleration is greatest at the extremes of motion (where velocity is zero) and zero at the equilibrium position (where velocity is maximum).
39. Can you have negative jerk on an acceleration-time graph?
Yes, you can have negative jerk on an acceleration-time graph. Negative jerk is represented by a downward-sloping line on the graph. This indicates that the acceleration is decreasing over time. For example, when a car's acceleration starts to decrease as it approaches its top speed, this would be represented as negative jerk on the acceleration-time graph.
40. What does the area between the acceleration-time graph and the time axis represent?
The area between the acceleration-time graph and the time axis represents the change in velocity over that time period. Areas above the time axis represent increases in velocity, while areas below the time axis represent decreases in velocity. The net change in velocity is the sum of these positive and negative areas.
41. Can you determine an object's initial velocity from its acceleration-time graph alone?
No, you cannot determine an object's initial velocity from its acceleration-time graph alone. The acceleration-time graph shows how the rate of change of velocity varies over time, but it doesn't provide information about the initial conditions. To find the initial velocity, you would need additional information, such as the velocity at a specific time or the displacement over a certain interval.
42. What does the acceleration-time graph of a rocket launch look like?
The acceleration-time graph of a rocket launch might look like:
43. How does the acceleration-time graph change when considering air resistance for a falling object?
When considering air resistance for a falling object, the acceleration-time graph changes from a constant line to a curve:
44. How does the acceleration-time graph of an elevator's motion typically look?
The acceleration-time graph of an elevator's typical motion might look like: