

Distance Time Graph
A distance-time graph represents how distance changes with time, an easy way to visualize motion. Imagine keeping track of your daily commute: as you pass by time, you are at various distances from home. A distance-time graph can describe whether you are going at a constant speed, slowing down, or stopping at signals. It is a powerful tool in physics, which deals with the issues of motion analysis and interpretation, and thus helpful to understand how speed, distance, and time are interrelated for all sorts of common life situations from driving to cycling to walking. In this article, we are going to learn about distance-time graphs, distance-time graphs for uniform motion, non-uniform motion and body at rest and many more.
What is a Distance-Time Graph?
A distance-time graph is a graph that shows the way in which the distance covered by an object varies with time. Time is represented along the x-axis while distance is along the y-axis. The shape and steepness of the line on a distance-time graph permits a determinate of the speed of an object when at constant speed, acceleration or if it is at rest. For instance, a straight positive sloping line indicates constant speed and a horizontal flat line would mean that the object is static. Graphs of distance over time are able to better image and understand motion patterns in physical settings and many other real-life situations.
Importance of Distance-Time Graph
When examining the motion of bodies, we use the distance-time graph. A distance-time graph relating to the motion of a body can be obtained by recording distance and time for the motion of a body and plotting the same data on a rectangle graph.
Also read :
- NCERT Solutions for All Subjects
- NCERT Notes for all subject
- NCERT Exemplar Solutions for All Subjects
Types of Distance-Time Graph
There are two types of motion uniform and non-uniform motion
Uniform Motion:
The motion of an item in which the object moves along a straight line and its velocity remains constant along that line while it covers equal distances in equal intervals of time, regardless of the length of time, is referred to as this sort of motion.
The above diagram represents the distance-time graph for uniform motion
Example of Uniform Motion:
- When an automobile travels at a speed of 10 m/s, it travels 10 metres in one second.
- Every second, the speed remains constant.
- The blades of a ceiling fan move back and forth.
Non Uniform Motion:
The motion of an object in which the object travels at a variable speed and does not cover the same distance in equal time intervals, regardless of the time interval duration, is referred to as this sort of motion.
The above diagram shows the Distance vs time graph for non-uniform motion
Example of Non-Uniform Motion:
- If a car travels 10 metres in the first two seconds and 15 metres in the next two seconds, the total distance travelled is 15 metres.
- Body at rest:
When a body or object is at rest, then the distance-time graph can be represented as follows:
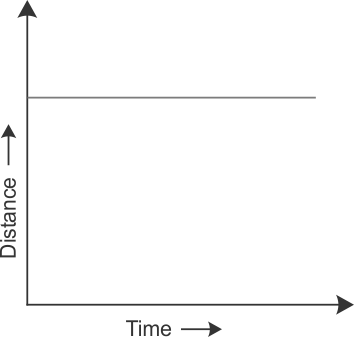
The above diagram shows a distance-time graph for a body at rest
|
Related Topics |
What are the Uses of the Distance-Time Graph
1. The character of motion is seen at a glance.
2. Relative motion at different intervals is possible.
3. Without performing any calculations, the zone of acceleration or retardation can be calculated.
4. The distance of a moving body can be computed at any time unit.
Frequently Asked Questions (FAQs)
The distance-time graph depicts how far a body travels in a given amount of time.
For example, in the case of uniform motion, the graph will be a straight line, however if the gradient increases, it indicates that the body is moving quickly.
The X-axis represents time, while the Y-axis represents distance, just like any other graph.
Students can calculate the speed and velocity of a body using this graph.
Furthermore, the area beneath the graph indicates the overall distance travelled by a body.
As a result, students may understand the following units using this graph without having to do any hard computations.
On a distance time graph, a straight line indicates that an object is moving at a constant speed.
A non-moving stationary item can alternatively be thought of as a body travelling at a constant speed.
Remember that this graph does not contain a downward-sloping line because every moving object "increases" its length with time.
It does, however, if an object returns to its original location.
On the distance time graph, different lines represent different speeds and motions.
As a result, in addition to understanding what a straight line entails, students must also be aware of different deviations in order to grasp the ideas.
There are some significant distinctions between distance time and speed-time graphs.
While the former indicates the overall distance travelled, the latter correctly depicts acceleration.
Aside from that, there are a few minor differences.
A velocity-time graph is also known as a speed-time graph.
These two graphs are equally significant in determining the flow and type of the movement through simple depiction.
However, time is plotted on a horizontal axis, while distance and speed are plotted on a vertical axis in both graphs.
1. The character of motion is seen at a glance.
2. Relative motion at different intervals is possible.
3. Without performing any calculations, the zone of acceleration or retardation can be calculated.
4. The distance of a moving body can be computed at any time unit.
