To draw the characteristic curve of a Zener diode and to determine its reverse breakdown voltage.
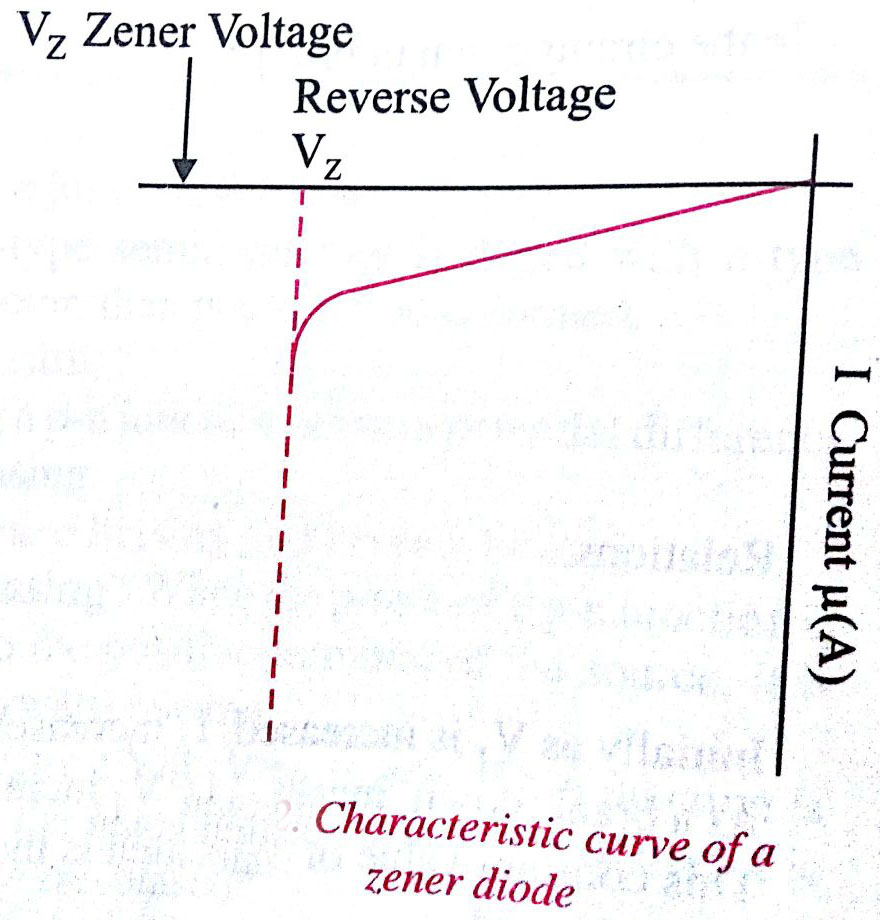
A Zener diode is a special type of diode designed to operate in the reverse breakdown region, providing a stable reference voltage. Unlike regular diodes, which are not designed to conduct in reverse bias, a Zener diode is engineered to maintain a constant voltage across its terminals once a specific reverse voltage—known as the Zener breakdown voltage—is reached. This unique characteristic makes Zener diodes invaluable in voltage regulation applications. To understand its behaviour, one can draw the characteristic curve of a Zener diode by plotting the current flowing through the diode against the applied reverse voltage. This curve helps visualize how the diode behaves under different reverse bias conditions, including the onset of breakdown and the voltage stabilization.
This Story also Contains
- Aim
- Apparatus
- Theory
- Formula used $ V_0=V_I-R_I I_I $ The constant value of $V_0$ gives reverse breakdown voltage.
- Result
- Solved Examples Based on the Characteristic Curve of a Zener Diode and Determine Its Reverse Breakdown Voltage.
- Summary
Aim
To draw the characteristic curve of a Zener diode and to determine its reverse breakdown voltage.
Apparatus
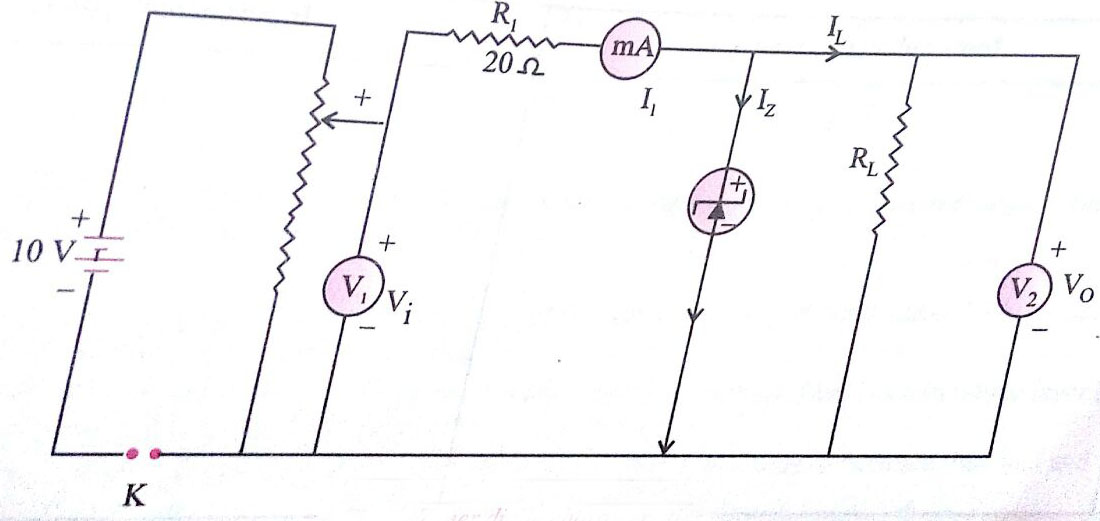
A Zener diode (with a small reverse breakdown voltage of about 6 volts ), [i.e., $V_z=6 \mathrm{~V}_{\mathrm{p}}$ ], a ten-volt battery, a high resistance rheostat, two $0-10 \mathrm{~V}$ voltmeter, one $0-100 \mathrm{~A}$ ammeter, one $20 \Omega$. resistance, one-way key, and connecting wires.
Theory
Zener Diode- It is a semiconductor diode, in which the n-type and the p-type sections are heavily doped, i.e., they have more percentage of impurity atoms. This heavy doping results in a low value of reverse breakdown voltage (BVR). This value can be controlled during manufacture. The reverse breakdown voltage of a Zener diode is called Zener voltage VZ.
The reverse current that results after the breakdown, is called Zener current (Iz).
Circuit ParametersIn the circuit given before. $V_I=$ Input (reverse bias) voltage $V_0=$ Output voltage $\left(R_L / I_L\right)$
$R_I=$ Input resistance $R_L=$ Load resistance
$I_I=$ Input current (reverse current)
$I_Z=$ Zener diode current
$I_L=$ Load current
Relations
$
\begin{array}{r}
I_L=I_I-I_Z \\
V_0=V_I-R_I I_I
\end{array}
$
Initially, as $V_I$ is increased, $I_I$ increases a little, then $V_0$ increases.
At the breakdown, the increase of $V_I$ increases $I_I$ by a large amount, so that $V_0=V_I-R_I I_I$ becomes constant. This constant value of $V_0$ which is the reverse breakdown voltage is called Zener voltage.
Formula used
$
V_0=V_I-R_I I_I
$
The constant value of $V_0$ gives reverse breakdown voltage.
Diagram

Procedure
1. Arrange the apparatus as shown in the circuit diagram.
2. Make all connections neat, clean and tight.
3. Note the least count and zero error of voltmeters and milli-ammeter. (micro-ammeter)
4. Bring moving contact of the potential divider (rheostat) near the negative end and insert the key K. Voltmeters and milli-ammeter will give zero reading.
5. Move the contact a little towards a positive end to apply some reverse bias voltage $\left(\mathrm{V}_1\right)$. Milli-ammeter reading remains zero. Voltmeters give equal readings. [i.e, $\left.\mathrm{V}_0=\mathrm{V}_I \ldots \Rightarrow \mathrm{I}_I=0\right]$
6. As $V_I$ is further increased, $I_I$ starts flowing. Then $V_0$ becomes less than $V_I$
Note the values of $V_p I_I$ and $\mathrm{V}_0$
7. Go on increasing $V_I$ in small steps of ). 5 V.
Note corresponding values of $\mathrm{I}_I$ and $\mathrm{V}_0$ which will be found to have increased.
8. As $V_I$ is made more and more, $I_I$ and $\mathrm{V}_0$ are found to increase. Values are noted.
9. At one stage, as $V_I$ is increased further, $I_I$ increases by a large amount and $\mathrm{V}_0$ does not increase. This is a reverse breakdown situation.
10. As $V_I$ is increased further, only $I_I$ is found to increase, $\mathrm{V}_0$ becomes constant.
Note values of $V_I I_I$ and $\mathrm{V}_0$
11. Increase $V_I$ to a value of 10 V, noting corresponding values.
12. Record your observations.
Calculations
Plot a graph between input voltage $V_I$ and input current $\left(I_I\right)$, taking $V_I$ along x -axis and $I_I$ along $\underline{\gamma}$-axis.
Result
The reverse breakdown voltage of the given Zener diode is...
Solved Examples Based on the Characteristic Curve of a Zener Diode and Determine Its Reverse Breakdown Voltage.
Example 1: The zener voltage of a Zener diode is kept at desired value by
1) Adjusting the input voltage
2) Adjusting the input current
3) By connecting an appropriate resistance in series
4) Changing the level of doping
Solution:
To draw the characteristics of the Zener diode and to determine its reverse breakdown voltage
*initially V1 increased, then I also increased a little then Vo increased.
At a breakdown increase of V1, increases I1 by a large amount so $V_0=V_I-R_I I_I$ becomes constant.
Const. value of VO gives reverse breakdown Voltage
Summary
The characteristic curve of a Zener diode is crucial for determining its performance in voltage regulation. By plotting the reverse current against the reverse voltage, you can observe the point at which the diode enters its breakdown region. This breakdown voltage, known as the Zener breakdown voltage, is where the diode maintains a nearly constant voltage despite changes in current. Drawing this curve allows you to see how effectively the Zener diode can stabilize voltage and determine its suitability for various applications requiring precise voltage control.