

Velocity Time Graphs - Definition, Example, FAQs
A velocity–time graph (VT graph) is one of the most important tools in understanding motion in physics. In this article, you will learn what a velocity–time graph is, how to read it, how to calculate acceleration from it, types of VT graphs, and how to solve Class 9–level questions based on these graphs.
In these topics, you will also learn constant velocity graphs, increasing and decreasing acceleration graphs, velocity–time relations, and much more exactly the way students need for exams.
Also read -
What is the Velocity-Time Graph?
A velocity–time graph represents how the velocity of a moving object changes with time.
- The horizontal axis (x-axis) represents time.
- The vertical axis (y-axis) represents velocity.
Velocity is the speed of an object in a given direction, and since it has magnitude and direction, it is a vector quantity.
A V-t graph helps us determine:
- Acceleration
- Constant velocity
- Increasing or decreasing motion
- Retardation
- Distance travelled (from area under the graph)
Let us study these cases one by one.
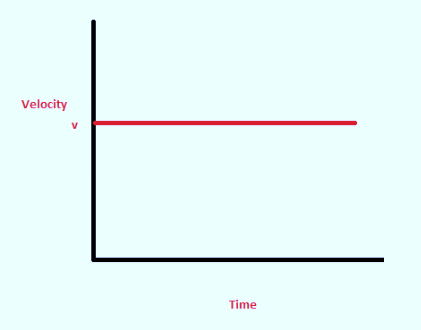
Case I: Constant Velocity (Zero Acceleration)
When an object moves with constant velocity, there is no change in speed, so acceleration is zero.
The graph will be a straight horizontal line, parallel to the time axis.
The following VT graph shows zero acceleration.
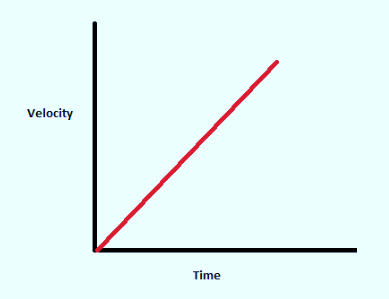
Case II:- Increasing Velocity or Constant Acceleration
If the velocity of an object increases at a uniform rate, the graph becomes a straight line sloping upward.
The following VT graph shows constant acceleration.
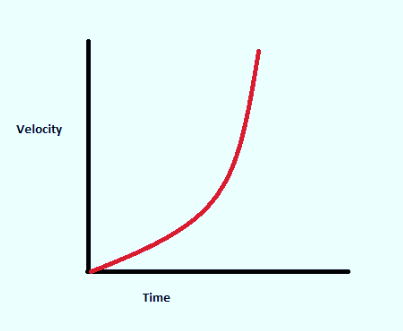
Case III:- Increasing rate of change of velocity or Increasing acceleration
If the rate of change of velocity increases throughout the motion, then the final velocity will be much more than the initial velocity. The initial velocity in this case can be zero as the acceleration of the object is increasing every second at some rate. The slope of the velocity-time graph in this case will lead us to conclude that the graph will form a curve. Hence, the curve in this slope has increasing/decreasing acceleration.
The following VT graph shows increasing acceleration.
We can obtain a decreasing velocity-time graph similar to the increasing velocity-time graph. In this case the slope will decrease as the velocity is decreasing. Here, in this case we will get a negative slope and the acceleration will be decreasing.
Applications of Velocity–Time Graph
- To find acceleration: The slope of the graph gives acceleration or retardation.
- To find distance travelled: The area under the graph gives the distance covered by the object.
- To know the type of motion: The shape of the graph shows whether the object is moving with constant velocity, speeding up, or slowing down.
- To find velocity at any time: The velocity of the object at any instant can be read directly from the graph.
- To compare motions: We can compare the motion of two objects by looking at their v–t graphs.
Also Read:
- NCERT solutions for Class 11 Physics Chapter 3 Motion in a straight line
- NCERT Exemplar Class 11 Physics Solutions Chapter 3 Motion in a straight line
- NCERT notes Class 11 Physics Chapter 3 Motion in a straight line
Also check-
- NCERT Exemplar Class 11th Physics Solutions
- NCERT Exemplar Class 12th Physics Solutions
- NCERT Exemplar Solutions for All Subjects
NCERT Physics Notes:
Frequently Asked Questions (FAQs)
The four common types are:
Constant velocity graph
Uniform acceleration graph
Uniform retardation graph
Non-uniform (curved) velocity graph
A velocity–time graph is also called a v–t graph.
A velocity–time graph is used to find the acceleration, retardation, distance travelled, and velocity at any instant. It also helps us understand whether the object is moving with constant, increasing, or decreasing velocity.
A velocity-time graph represents the different velocities of a moving object at different times.
The velocity time graph represents acceleration as we know that the rate of change of velocity gives us acceleration.
When the velocity is constantly increasing, we get constant acceleration in that case.
