

Vertical and Horizontal Transformation: Definition & Equation
Understanding how the function transforms is important in mathematics. Functional transformation alters the position and size of the graph of the function. Transformation can be of several types like Horizontal transformation and Vertical transformation. It involves moving graphs up and down and helps the analyst to find different insights thus solving complex problems within no time. This makes the study of functions very easy and breaks down the complexity of analysis.
This Story also Contains
- Functions
- Function Transformations
- What are Function Transformations?
- Translation of Functions
- Dilation of Functions
- Reflections of Functions
- Graphing Transformations of Functions
- Vertical and Horizontal Transformation
- Solved Examples Based on Vertical and Horizontal Transformation
This article will cover the concept of vertical and horizontal transformations. This concept falls under the broader category of sets relation and function, a crucial chapter in class 11 Mathematics. It is not only essential for board exams but also for competitive exams like the Joint Entrance Examination (JEE Main), and other entrance exams such as SRMJEE, BITSAT, WBJEE, BCECE, and more.
Functions
It can be defined as a relationship between two or more set of information. A relation from a set $A$ to a set $B$ is a function from $A$ to $B$ if every element of set $A$ has one and only one image in set $B$.
OR
$A$ and $B$ are two non-empty sets, then a relation from $ A$ to $B$ is said to be a function if each element $x$ in $A$ is assigned a unique element $f(x)$ in $B$, and it is written as
$f: A ➝ B$ and read as $f$ is mapping from $A$ to $B.$
Function Transformations
This process in simple terms means that the curve representing the graph either "moves to left/right/up/down" or "it expands or compresses" or "it reflects", like any kind of change in its shape and position. For example, the graph of the function $f(x) = x^2 + 10$ is obtained by just moving the graph of $g(x) = x^2$ by $10$ units up. Function transformations are very helpful in graphing the functions just by moving/expanding/compressing/reflecting the curve without actually needing to graph it from scratch. This makes the job of analysis very easy and effective.
What are Function Transformations?
A function transformation either "moves" or "resizes" or "reflects" the graph of the parent function. In other words, it performs mainly 3 functions.There are mainly three types of function transformations:
- Translation
- Dilation
- Reflection
Transformation | Function | Change |
Translation | Slides or moves the curve. | position |
Dilation | Stretches or shrinks the curve. | size |
Reflection | Flips the curve and produces the mirror image. | position |
Translation of Functions
A translation occurs when every point on a graph moves by the same amount in the same direction, which means that the direction and amount points out towards one way. There are two types of translations of functions.
1. Horizontal translation
In this translation, the function moves to the left side or right side. This changes a function $y = f(x)$ into the form $y = f(x ± k)$, where '$k$' represents the horizontal translation. Conditions:
- if $k > 0$, then the function moves to the left side by '$k$' units.
- if $k < 0$, then the function moves to the right by '$k$' units.
2. Vertical Translation
In this translation, the function moves to either up or down. This changes a function $y = f(x)$ into the form $f(x) ± k$, where '$k$' represents the vertical translation. Conditions :
- if $k > 0$, then the function moves up by '$k$' units.
- if $k < 0$, then the function moves down by '$k$' units.
Dilation of Functions
A dilation is a stretch or a compression. If a graph undergoes dilation parallel to the x-axis, all the x-values are increased by the same scale factor. Similarly, if it is dilated parallel to the y-axis, all the y-values are increased by the same scale factor. There are two types of dilations.
- Horizontal Dilation
- Vertical Dilation
1. Horizontal Dilation
The horizontal dilation of a function either stretches/shrinks the curve horizontally. It changes a function $y = f(x)$ into the form $y = f(kx)$, with a scale factor '$\frac{1}{k}$', parallel to the x-axis. The conditions are as follows:
- If $k > 1$, then the graph shrinks.
- If $0 < k < 1$, then the graph stretches..
2. Vertical Dilation
The vertical dilation of a function either stretches/shrinks the curve vertically. It changes a function $y = f(x)$ into the form $y = k f(x)$, with a scale factor '$k$', parallel to the y-axis. The conditions are as follows:
- If $k > 1$, then the graph stretches.
- If $0 < k < 1$, then the graph shrinks.
Reflections of Functions
A reflection of a function is just the image of the curve with respect to either x-axis or y-axis. This occurs whenever we see the multiplication of a minus sign happening somewhere in the function. The conditions are as follows:
- $y = - f(x)$ is the reflection of $y = f(x)$ with respect to the x-axis.
- $y = f(-x)$ is the reflection of $y = f(x)$ with resepct to the y-axis.
Graphing Transformations of Functions
Identifying the transformation by looking at the original and transformed graphs is easy. But when a graph is given, graphing the function transformation sometimes becomes difficult.So, we can simplify the process more with the following procedure. Here, we are transforming the function $y = f(x)$ to $y = a f(b (x + c)) + d$.
- Step 1: We note down some coordinates on the original curve that define its shape. i.e., we now know the old x,y coordinates.
- Step 2: To find the new $x$-coordinate of each point,we just set "$b (x + c) =$ old $x$-coordinate" and solve this for x.
- Step 3: To find the new $y$-coordinate of each point, we just apply all outside operations (of brackets) on the old $y$-coordinate. i.e., find $ay + d$ to find each new $y$-coordinate where '$y$' is the old $y$-coordinate.
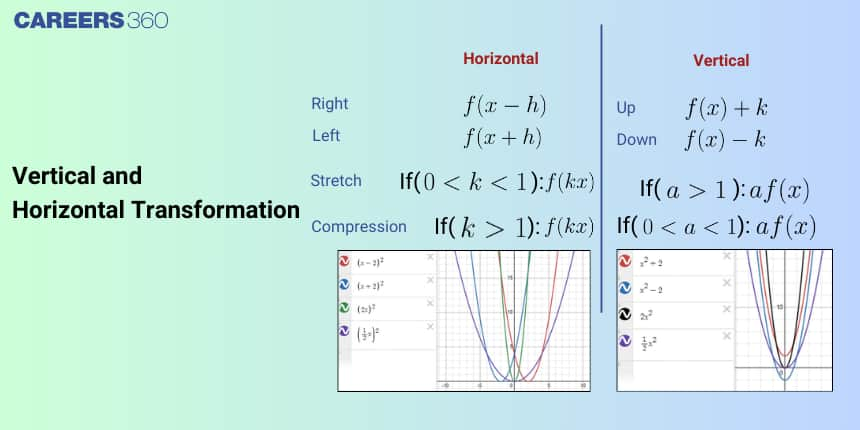
Vertical and Horizontal Transformation
Vertical shift $f(x) → f(x) ± a$
A vertical shift of a function occurs if we add or subtract the constant to the function $y = f(x)$
For $a > 0$, the graph of $y = f(x) + a$ is obtained by shifting the graph of $f(x)$ upwards by $‘a’$ units,
whereas the graph of $y = f(x) − a$ is obtained by shifting the graph of $f(x)$ downwards by ‘$a$’ units.
For Example:
The graph of the function $f(x)=x^2+4$ is the graph off $(x)=x^{\wedge} 2$ shifted up by 4 units;
The graph of the function $f(x)=x^2-4$ is the graph of $f(x)=x^2$ shifted down by $4$ units.

Horizontal shift: $f(x) → f(x±a)$
A horizontal shift of a function occurs if we add or subtract the same constant to each input $x$.
For $a > 0$, the graph of $y = f(x + a)$ is obtained by shifting the graph of $f(x)$ to the left by ‘a’ units.
The graph of $y = f(x − a)$ is obtained by shifting the graph of $f(x)$ to the right by ‘$a$’ units.
For Example:
$f(x) = |x + 3|$
The graph of $f(x) = |x + 3|$ is the graph of $y = |x|$ shifted leftwards by $3$ units. Similarly, the graph of $f(x) = |x − 3|$ is the graph of $y = |x|$ shifted rightward by $3$ units

Recommended Video Based on Vertical and Horizontal Transformation
Solved Examples Based on Vertical and Horizontal Transformation
Example 1: The area bounded by the lines $y=|| x-1|-2|$ and $\mathrm{y}=2$ is
1) $8$
2) $10$
3) $12$
4) $6$
Solution
Given the equation of curve are
$y = ||x-1|-2|$
and, $y = 2$
Plot the curve on the graph

We have to find area of triangle $ACD$ and triangle $BDE$
$\begin{aligned} & \text { Area }=\frac{1}{2} \times 2 \times C D+\frac{1}{2} \times 2 \times D E \\ & \text { Area }=C D+D E=8\end{aligned}$
Example 2: Which of the following is the graph of $y = |x| + 5$?
1) 
2) 
3) 
4) 
Solution
As we have learnt in
Vertical and Horizontal Transformation -
For $a > 0$, the graph of $y = f(x) + a$ is obtained by shifting the graph of $y = f(x)$ upwards by ‘$a$’ units
The graph of $y=|x|$

Now to draw the graph of $y=|x|+5$, the graph of $|x|$ is shifted upwards by $5$ units as shown below
Frequently Asked Questions (FAQs)
Vertical stretch or shrink occurs when the required function is multiplied by a number. Horizontal stretch or shrink occurs when the input is multiplied by a number.
The difference that occurs is because vertical dilations occur when we scale the output of a function, whereas horizontal dilations occur when we scale the input of a function.
2.
Ans :
3.
Ans :
4.
Ans :
5.
Ans:
A vertical scaling multiplies or divides every y-coordinate by a constant while does not change x-coordinate. A horizontal scaling multiplies or divides every x-coordinate by a constant while leaving the y-coordinate unchanged.
Horizontal translations refer to movements of a graph of a function horizontally along the x-axis by changing the x values only and not y values.
Horizontal scaling of function $f(x)$ is given by $g(x) = ± f(Cx)$.
