Data Interpretation: Meaning, Questions, Examples, Formula
Data Interpretation: Structure
The introduction to data interpretation is a very important part of mathematics. Data interpretation questions come in almost every examination. Data interpretation meaning in Hindi is “Explaining the data”. Data interpretation is based mainly on charts, tables, or graphs.
Students need to understand the data interpretation questions and solutions.
The data interpretation syllabus contains “data interpretation for CAT”, “data interpretation pie chart questions”, “data interpretation pie chart formula”, “data interpretation bar graph line graph pie chart”, “data interpretation bar graph tricks”, “data interpretation tabular form questions”, “histogram data interpretation questions” and “line graph interpretation examples” etc.
- Data Interpretation: Structure
- What is Data Interpretation?
- Importance of Data Interpretation
- Concepts required to solve the questions based on data interpretation
- Types of Data Interpretation Graphs
- Important points

Solving the questions on data interpretation is based on your analytical and quantitative skills. You will find data interpretation questions with solutions, data interpretation pie chart questions in this article.
What is Data Interpretation?
Data interpretation is a process of analysing a given data set getting meaningful insight, and understandably presenting them by using graphs, charts or tables. The main aim of data interpretation is to understand what is in the data and predict or arrive at relevant conclusions.
There are two types of data interpretation.
Qualitative method: In this method, we analyse categorical data.
Quantitive method: In this method, we analyse numerical data.
Importance of Data Interpretation
Data interpretation is very important for analysing and interpreting data in a table or graph form.
Data interpretation is crucial for making informed decisions in business, research, and everyday life. Accurate interpretation can lead to better choices and strategies.
It can be used to predict upcoming trends and future competition.
It helps us to gain knowledge and achieve a competitive strategy.
To validate hypotheses and in research fields, data interpretation is very useful.
It gives us insight into complex issues to solve them easily.
Concepts required to solve the questions based on data interpretation
To solve data interpretation questions, we need to learn about some concepts first.
But first, you have to understand and analyse the data carefully.
Basic arithmetic and algebra: Basic arithmetic operations like addition, subtraction, multiplication and division are useful to solve data interpretation questions. We also need to understand basic algebraic formulae.
Percentages and Ratios: To compare and analyse data, we need to learn about percentages and ratios.
Most of the pie chart questions involve either percentages or ratios.
Average: After understanding the dataset, to answer the given questions, we need to learn about mean, median and mode.
Graphs and Charts: We need to learn about graphs and charts to identify which is which data interpretation problem and when to use those graphs or charts.
Tabular form: Data given in tabular forms need to be understood carefully. We need to analyse headings, levels and arrangement of data.
Statistics: We need to have basic knowledge of statistical measures such as variance, standard deviation, and correlation to solve these problems.
Conclusion: The conclusion of a data interpretation set is very important because it will be the explanation of the whole data. Decisions will be dependent on this conclusion.
Mental calculations: It is very important to do mental calculations to solve data interpretation problems in competitive exams to save time.
Types of Data Interpretation Graphs
Data interpretation involves analysing various types of graphs to extract meaningful information.
Some of the types of graphs are:
Bar graph
Line graph
Pie chart
Tabular data interpretation
Histogram
Spider graph
Caselet
Combination of two or more graphs
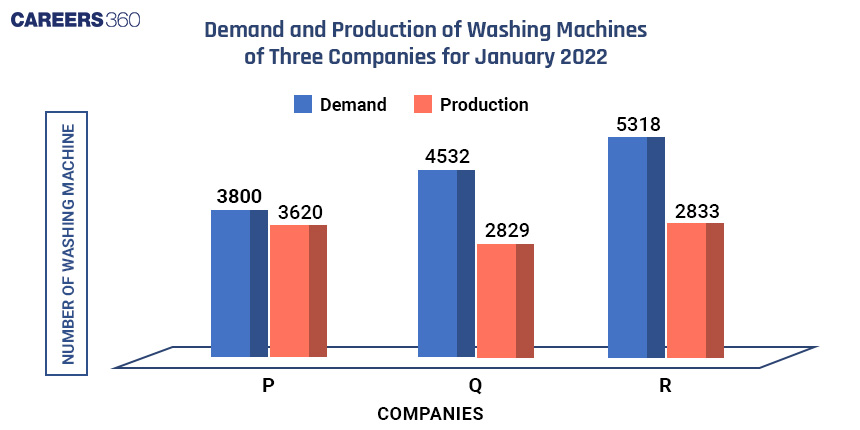
Bar graph
Data represented with rectangular bars where one parameter is given on the x-axis and the other parameter is given on the y-axis is called a bar graph.
These bars can be drawn horizontally or vertically. Every bar represents a different category and the length of the bar is its value.
Example:
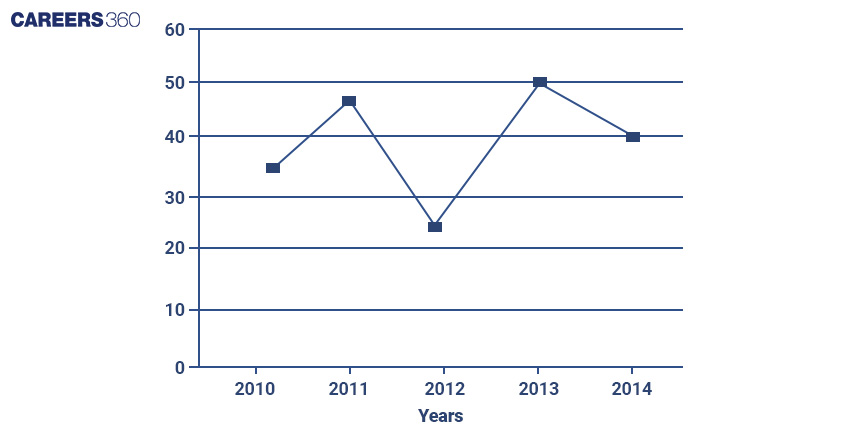
Line graph
A line graph shows the relationship between points over a period of time by a line or curve.
It is best for displaying continuous data or a sequence of values.
Example:
The following chart represents the number of employees recruited in different years in a company.
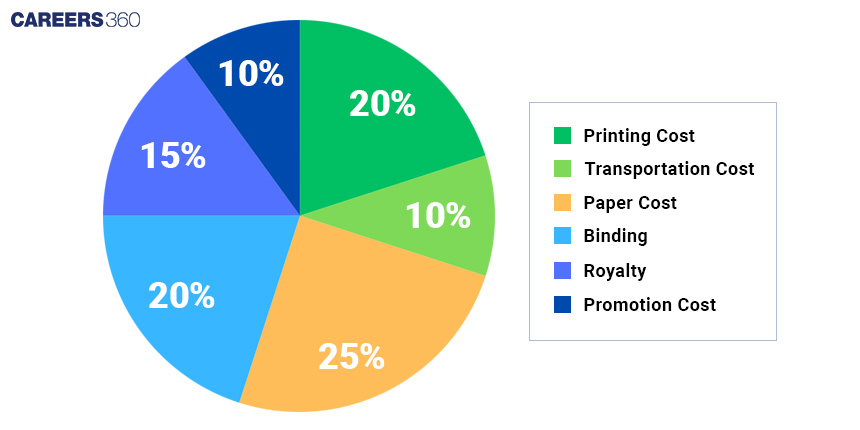
Pie Chart
A circular chart is divided into sectors, each representing a proportion of the whole is called a pie chart.
It is effective for showing the relative sizes of parts of a whole.
Pie charts are of two types.
Exploded pie chart
Doughnut pie chart
Example:
Various expenditures incurred by a publishing company for publishing books in 2011 are given below in a pie chart.
Tabular data interpretation
In tabular data interpretation, data is presented in rows and columns.
It is useful for displaying detailed and exact data.
Example:
The table below shows the percentage of literate people in 6 cities. This table also shows the ratio of males to females among literate people.
City | Percentage of literate people | Males : Females |
1 | 80 | 4 : 5 |
2 | 85 | 7 : 4 |
3 | 78 | 3 : 2 |
4 | 63 | 1 : 1 |
5 | 92 | 9 : 7 |
6 | 58 | 2 : 3 |
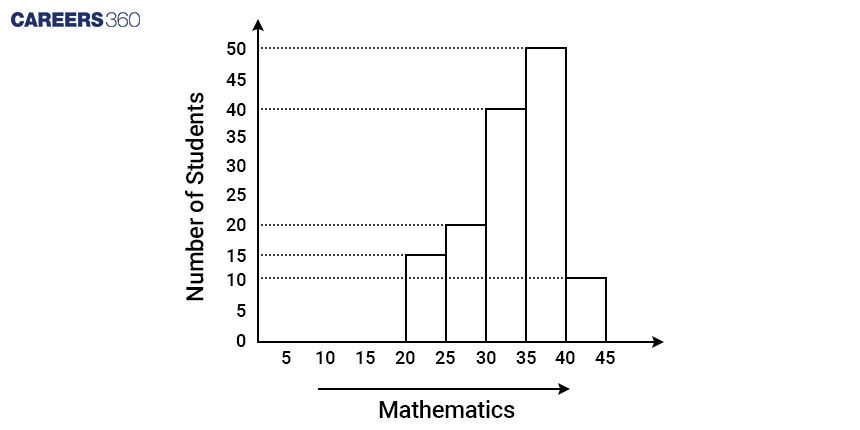
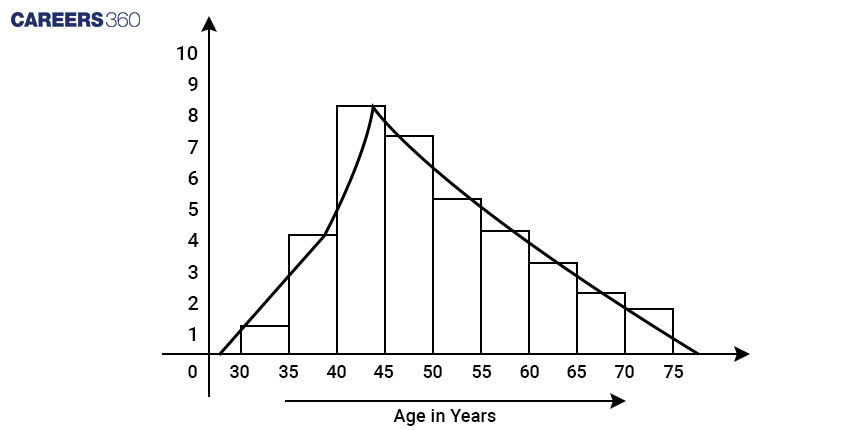
Histogram
Similar to a bar graph, it represents the distribution of numerical data by showing the number of data points that fall within a specified range.
It is used to visualize the frequency distribution of a dataset.
Example:
The following is a histogram of marks in mathematics (out of 50) of students in a class.
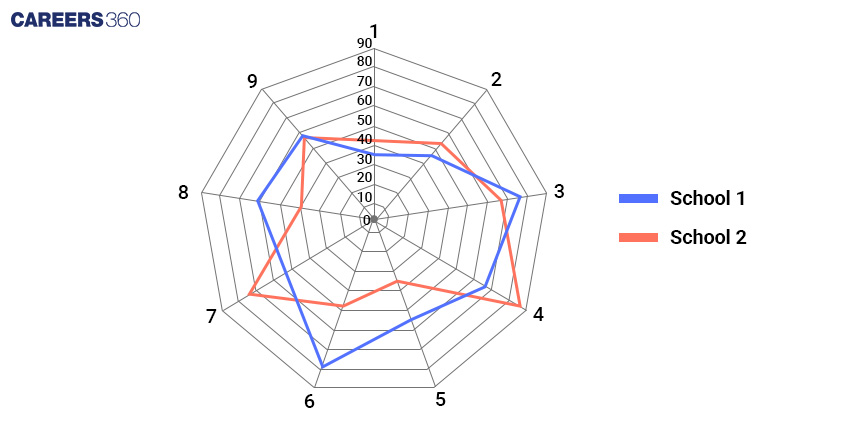
Spider graph
A spider graph is also called a radar chart
It is a circular graph with multiple axes starting from the same point forming a web-like structure.
It is used when we can’t accommodate different quantitive scales in a bar graph or the objective is to compare symmetry rather than magnitudes.
It is not clattered as a bar chart and shows quick visualization of data from various sources.
Example:
Caselet
A Caselet is a collection of facts presented in the form of paragraphs. There are no tables or graphs in a Caselet. To answer the questions, one must read the information and create a table or organise the data provided.
Caselet can be of two types.
Paragraph based on reasoning
Paragraph based on numerical data
Example:
“A total of 1650 students are studying in an engineering college in different departments. The ratio of male students to female students in the college is 86:79. The college has a total of 5 departments which are mechanical, civil, electrical, Biotechnology and computer science. A total of 198 males study in the mechanical department. 18% of the students study in the civil department in which male to female ratio is 5:4.
In the biotechnology department, 77 male students are studying and the number of female students in this department is 5/7th of the number of males. The total number of male students in the civil department is equal to the number of female students in the mechanical department. The number of males in the biotechnology department is half of the number of total male students in the computer science department. In the electrical department, the male-to-female ratio is 14:19.”
Now one has to create a table from the information above to solve the questions from the dataset.
Combination of two or more graphs
Integrates different types of graphs into one chart for a comprehensive analysis.
It provides a more holistic view of the data.
Example:
The diagram shows the age distribution of patients admitted to a hospital on a particular day.
Important points
A Bar graph compares quantities of different categories.
A line graph shows trends over time.
A pie chart displays the relative sizes of parts of a whole.
A tabular data interpretation provides detailed and exact data in tables.
A histogram represents the frequency distribution of numerical data.
A spider graph or radar chart compares multiple variables.
A caselet is a scenario-based data interpretation.
A combination graph integrates multiple graph types for comprehensive analysis.
Frequently Asked Questions (FAQs)
Data interpretation is a process of analysing a given data set getting meaningful insight, and understandably presenting them by using graphs, charts or tables. The main aim of data interpretation is to understand what is in the data and predict or arrive at relevant conclusions.
There are two types of data interpretation.
Qualitative method: In this method, we analyse categorical data.
Quantitive method: In this method, we analyse numerical data.
Data interpretation is crucial for informed decision-making, identifying trends, solving problems, communicating information clearly, improving efficiency, and validating hypotheses or theories in various fields.
Data interpretation is used in various real-life situations such as
Business sector
Financial analysis
Market research,
Healthcare statistics,
Educational assessments
Scientific research
Weather forecasting
To interpret a bar graph, examine the labels on the x-axis and y-axis to understand what each axis represents, look at the height or length of the bars to determine the values, and compare the bars to identify patterns, trends, and differences among the data categories.
Data analysis involves collecting, processing, and summarizing data to extract useful information, while data interpretation focuses on understanding and making sense of the analyzed data to draw conclusions and make decisions.